Learn How I Trade NQ Futures
Start with my free A–Z NQ strategy, then use the lessons and real sessions to go deeper. No paid course and no magic indicator.
Start Here
If you watch one video first, make it this one. It explains how I build my higher-timeframe bias, choose the draws on liquidity I am watching, use CISDs and IFVGs for entries, and set my stop, target, and risk.
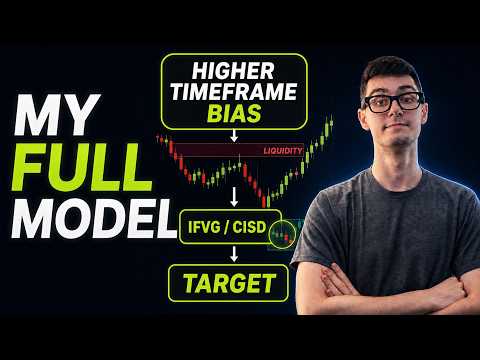
My NQ Trading Strategy Explained (Full A–Z Model)
My full current NQ strategy: higher-timeframe analysis, draws on liquidity, fair value gaps, SMT, CISD and IFVG entries, stop placement, risk, partials, break-even, and trailing.
Watch on YouTube →The Process in Four Steps
Every good trade starts with higher-timeframe analysis. The CISD or IFVG comes later, after I have a bias, a narrative, and a draw on liquidity.
I start on the daily and weekly charts, see which fair value gaps are being respected or disrespected, and build my bias and narrative.
I mark data highs and lows, Asia and London highs and lows, 9:30 highs and lows, equal highs and lows, and low-resistance liquidity that align with the bias.
Once price trades into an area that fits the narrative, I use a CISD or IFVG as my entry model and compare NQ with ES for SMT.
I set the stop, target, risk, and number of contracts, then use partials, break-even, full TP, or a trailing stop based on the draw on liquidity and what NQ and ES are doing.
More about my approach and the concepts I use
No paid course and no magic indicator. I start with higher-timeframe analysis and build a narrative from the daily and weekly charts. Then I mark the draw on liquidity—9:30 highs and lows, data highs and lows, equal highs and lows, and low-resistance liquidity—before I look for a CISD or IFVG entry. CISDs and IFVGs are entry models inside the full strategy, and I still use discretion.
Current strategy first. Real recaps and live sessions next.
Terms Used Here
A quick reference for the language I use throughout the lessons.
- Draw on liquidity
- The specific high, low, or fair value gap (FVG) I am watching price trade toward.
- SMT
- Divergence between NQ and ES—for example, one takes a marked high or low while the other does not. SMT is not a trade by itself.
- CISD
- Change in the State of Delivery. I mark the reference candle body, then wait for a confirming candle-body close and retest, only when it fits my bias and draw on liquidity.
- IFVG
- Inverse Fair Value Gap. A fair value gap that price trades through and I use from the opposite side, only when it fits the higher-timeframe bias and draw on liquidity.
Learn the Model
The playlist is the living curriculum. It starts with the current A–Z overview and stays current as I add focused lessons instead of making this website hand-pick a random catalog.
Evergreen Deep Dives
These three lessons add real depth without competing with the current A–Z overview.

How I Find Daily Bias on NASDAQ Using ICT Concepts
How I find my higher-timeframe draw and decide whether I am bullish or bearish before looking for a lower-timeframe entry.
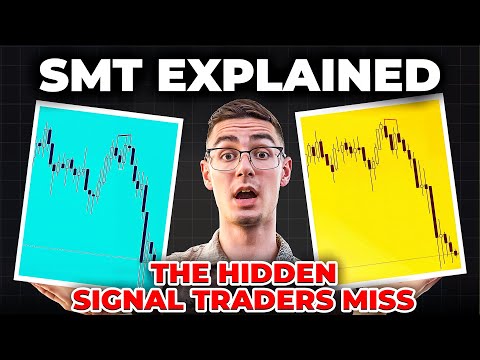
How I Use SMT Divergences in My Trading
How I compare NQ and ES and use SMT with the highs, lows, and targets I am already watching. SMT is not a trade by itself.

CISD Explained: My #1 Entry Model for NQ
How I mark the reference candle body, wait for the confirming close, and use the retest only when it fits the higher-timeframe bias and draw on liquidity.
See It Applied
Learn the model first, then choose the amount of context you want: a focused post-session breakdown, a transparent backtest, or the full uncut trading session.
Simulated and hypothetical results notice — collapse or expand
Some videos in these playlists include backtests or trading on simulated prop-firm evaluation or sim-funded accounts. Any result is one example from my experience—not a typical, promised, or expected outcome.
THESE RESULTS ARE BASED ON SIMULATED OR HYPOTHETICAL PERFORMANCE RESULTS THAT HAVE CERTAIN INHERENT LIMITATIONS. UNLIKE THE RESULTS SHOWN IN AN ACTUAL PERFORMANCE RECORD, THESE RESULTS DO NOT REPRESENT ACTUAL TRADING. ALSO, BECAUSE THESE TRADES HAVE NOT ACTUALLY BEEN EXECUTED, THESE RESULTS MAY HAVE UNDER- OR OVER-COMPENSATED FOR THE IMPACT, IF ANY, OF CERTAIN MARKET FACTORS, SUCH AS LACK OF LIQUIDITY. SIMULATED OR HYPOTHETICAL TRADING PROGRAMS IN GENERAL ARE ALSO SUBJECT TO THE FACT THAT THEY ARE DESIGNED WITH THE BENEFIT OF HINDSIGHT. NO REPRESENTATION IS BEING MADE THAT ANY ACCOUNT WILL OR IS LIKELY TO ACHIEVE PROFITS OR LOSSES SIMILAR TO THESE BEING SHOWN.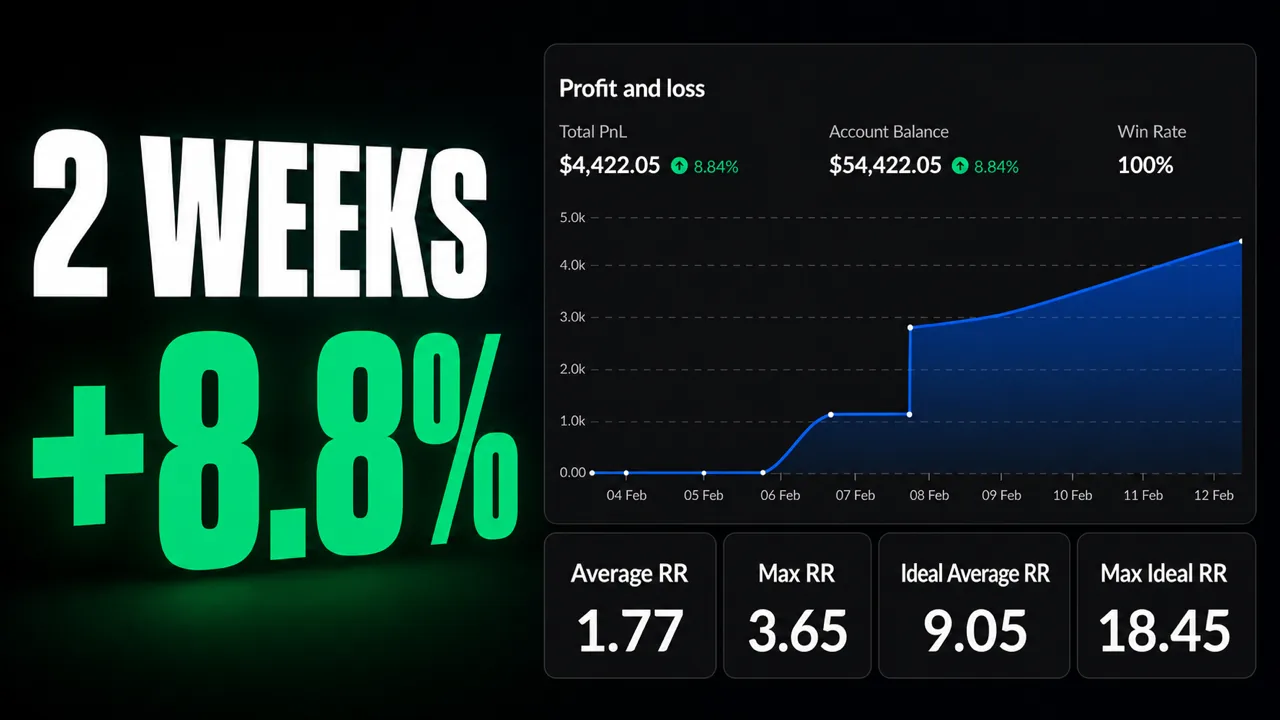
I Backtested My Current NQ Model for 1 Hour
A full one-hour replay of two weeks of NQ price action: daily bias, NQ and ES, data and session highs and lows, SMT, IFVGs, CISDs, trade management, and the passes that mattered. One sample—not a promise of future results.
Watch on YouTube →Trade Recaps
Post-session explanations of my higher-timeframe read, liquidity draws, entries, risk, and management—including wins, losses, mistakes, passes, and no-trade days.
Live Trading Recordings
Full sessions show the analysis, waiting, execution, management, mistakes, and no-trade decisions that disappear when only the cleanest chart is shown afterward.
Build the Mental Game
The mechanics have evolved, but discipline, variance, losing streaks, emotional control, and process quality do not stop mattering.
Start With the Model, Then Watch the Process
Start with the A–Z strategy before judging a recap or copying a chart. Test the ideas, define the loss you can accept, and use the live recordings to see what waiting and passing actually look like.